SESSION II
Climate vulnerability, Impacts and Projections (based on scientific evidence)
Download playbook
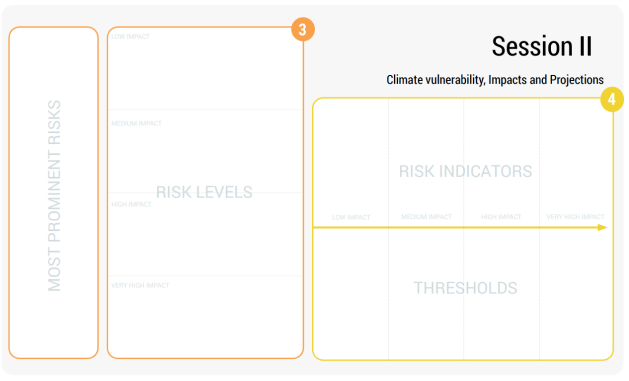
The objective of Session 2 is to map the most prominent climate risks as identified throughout Session 1, how that climate risk is likely to evolve (Risk Level) in terms of impact, and what indicators (quantitative, qualitative) might be identified that can serve as a critical threshold to determine the evolution of the risk impact. To do so, the moderator could refer to the risks evoked in the risk chain (session I), workshop participants would have to agree on (e.g., voting process) the most prominent risk to be addressed. Use one canvas per sector.
For the organisation of this session it is advised to collaborate with scientists and researchers that have the scientific knowledge on the impacts of climate change on the territory. For the TransformAr project we resorted to scientists and climate experts such as ACTERRA, CMCC, PIK and E3M. The experts presented climate models, figures, maps, projections of hazards, clarified intermediary impacts of CC as well as their socio-economic ramifications on various sectors. Collaboration with local universities and research centres is advised.
Objectives
- During session 2 we will explore what kind of scientific information we can find on the aspects identified in the first session.
- The goal is to substantiate these aspects with available scientific knowledge and information.
- From this information, the most prominent risks and risk levels for the region can be drawn in scientific manner.
- A next objective is to determine the risk impact and threshold values of identified climate change hazards.
- The second session adds a scientific layer to the first session. It either confirms or not the findings of the first session. This is crucial to give ground for a solid discussion and proposal of sound solutions.
Guidelines
- There will be 3 time slots foreseen of about 20 - 25 minutes where the climate experts share their insights.
- After every presentation, there will be an opportunity for participants to ask questions.
- It is up to the climate experts to process the conclusions from the first session into scientific region-specific data.
- Take sufficient preparation time between sessions 1 & 2 to translate general climate data into region-specific data.
- Keep in mind that the session participants are usually not climate experts nor have the same knowledge.
- Try to make the information as simple and understandable as possible: Consider using clear graphs, maps on which zones are marked, evolutions over time, infographics, and so on.
Proposed agenda

Overview of 3 scientific focus areas
For this part of the session, scientists are invited to present maps, projections, and climate data that are particular at the scale of the territory. Some data could be found on existing local, European, or international climate and adaptation platforms such as Copernicus, Climate Adapt, among others. A list of adaptation platforms can be found here. The use of existing data avoids “re-inventing” the wheel.
There are 3 main focus areas: biophysical hazards, Intermediary impacts and Socio-economic ramifications. For each of these areas, it is important to present the data in such a way that makes practical sense to the local stakeholders. At the end of the presentation, a quiz can be included to determine how much of the information have participants remembered or a Q&A session could be organised to keep participants engaged.
Fill in the main canvas with the participants
The canvas for Session II is divided into 2 parts: Risk Prioritisation and Impact Assessment.
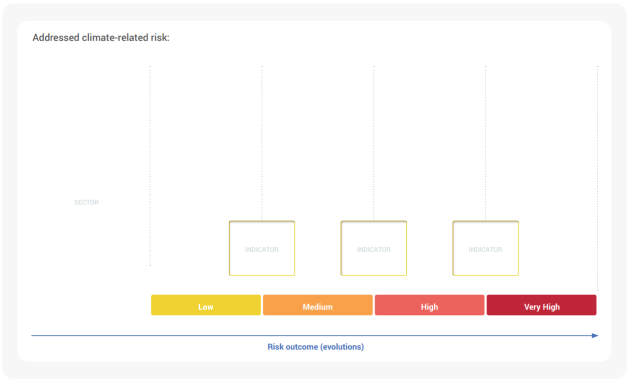
For the Risk prioritisation, you will need to do two things: Decide on the most prominent climate risks and on the risk levels. You can do this by asking the question: ‘What are in your opinion the most prominent climate risks considering presented projections/hazards?’ To develop adaptation pathways it would be better to focus on one prominent risk, this allows for proposing adequate, specific and focused adaptation measures in response. Another question you should ask is: “How is the risk level likely to evolve across different impacts? E.g. What outcome(s) do you consider as low, medium, high or very high risk?”.
For the second part of this session, you will brainstorm on the climate risk indicator and the critical thresholds. Which indicator would you consider as one that determines the evolution of risks (quantitative, qualitative)? I.e., What value/characteristic allows to determine that the risk could become more intense and go from low to medium, from medium to high, and from high to very high. Critical thresholds usually overlaps with the risk indicator. It determines the passage from one risk level to another and the need for additional measures to adapt to climate change.
You can find an example for this session in the playbook.

Fill in the conclusion canvas
After the second session is finalised the organiser can create a conclusion canvas that summarises all risk components per sector. The canvas allows to present a summary of the results, and to kick off the following session.
You can find an example in the playbook.

